Buy High, Sell High?
The old adage about investing successful investing goes, buy low, sell high. But today, with the stock market at all time highs and interest rates near historical lows, it seems challenging, if not impossible, to follow this sage advice. Therefore, I thought it would be informative to see what history can tell us about market returns when investing at all-time highs, holding for increasing periods of time, and then selling.
Using S&P 500 daily observations from 1950 through August of 2019, I analyzed index returns that would have been earned by investing at all-time market highs and then selling 1, 5, 10, and 20 years later. The results show that investment durations 10 and 20 years yield positive returns while the 1 year duration yields losses 26.4% and 10.3% of the time respectively. Furthermore, the magnitude of losses vary widely with about 40% being greater than 10%. When compared to investing in the S&P 500 when it is less than 95% of its historical all-time high value, we find that 1 and 5 year holding periods yield loss probabilities that are about 4 percentage points lower (22% and 6.4%). However, the probability of a loss at least 10% in magnitude increases by nearly 29%.
Overall, these results show that buying and holding over extended periods of time, at least roughly 10 years, would have avoided incurring investment losses under any starting conditions and support the idea that market timing was not a material factor for long-term investors during this time period.
For shorter time horizons, buying at times when the index was off its all-time highs led to a roughly 20% reduction in loss risk.
The Data: Daily S&P 500 Returns
According to Wikipedia, "the S&P 500 is a stock market index that measures the stock performance of 500 large companies listed on stock exchanges in the United States. It is one of the most commonly followed equity indices, and many consider it to be one of the best representations of the U.S. stock market. The average annual total return of the index, including dividends, since inception in 1926 is 9.8%; however, there were several years where the index declined over 30%. The index has posted annual increases 70% of the time."
For this study, I collected 17,520 daily returns, excluding dividends, from the S&P 500, beginning on January 3, 1950 and ending on August 19, 2019, from Yahoo Finance. The data set, $D$, can be found here.
Each observation, $d \in D$, contains the following data points, summarizing intra-day value dynamics.
| Date | Open | High | Low | Close | Adj Close | Volume |
|---|---|---|---|---|---|---|
| Aug 05, 2019 | 2,898.07 | 2,898.07 | 2,822.12 | 2,844.74 | 2,844.74 | 4,513,730,000 |
All-Time Highs and Returns Through Time
We identify historical all-time highs by sorting observations in time ascending order such that $d_i$ is the observation occuring the day before $d_{i+1}$. Then, for each $d_i$, we compare its adjusted close value, $c_i$, to the maximum adjusted close value of all days prior to $d_i$, $c_{max}$.
If $c_i > c_{max}$, we classify $d_i$ as an all-time high and compute the returns associated with holding a single share for 1, 5, 10, and 20 years. The return, $r_t$ for $t \in (1,5,10,20)$ is computed as the ratio of adjusted close values $t$ years in the future to the current all-time high, $c_{i + 365t} / c_{i}$. When $r_t > 0$, the investment yields a positive return and when $r_t < 0$, the investment yields a negative return.
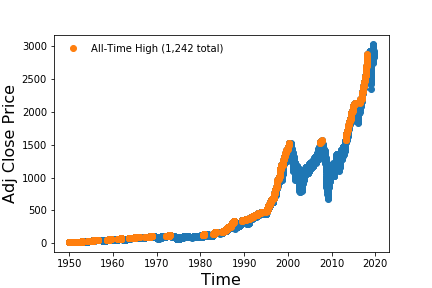
The figure below overlays the occurances of the S&P's prior 1,242 all-time market highs with the daily adjusted closing values of the index.
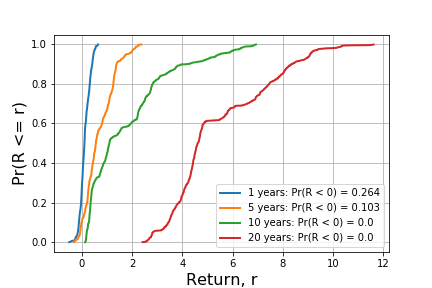
For each of the all-time high observations, the returns for investment periods described above are computed. The figure below shows the cumulative distribution function (CDF) of return values for each of these. A critical value characterizing risk for an investor is the probability of loss. The CDF shows that durations 1 and 5 have loss probabilities of 0.264 and 0.103 respectively. Later durations, 10 and 20, experience no losses. In general, the historical data support the buy and hold rule of thumb used by many investors. That is, on a historical basis, investing in the index at all-time highs would have yielded no losses if the assets were held for 10 or 20 years.
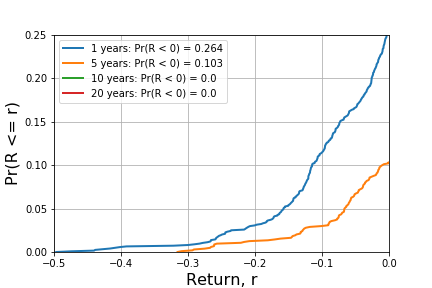
For durations 1 and 5, it is worth investigating the magnitudes of losses. The figure below examines left tails of the CDFs plotted above to highlight the likelihoods of extreme losses of each holding period.
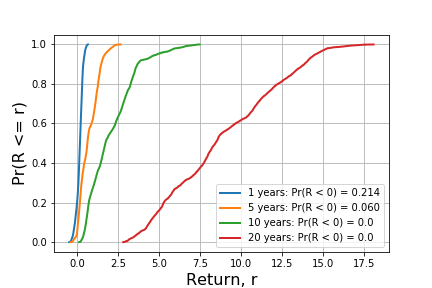
It is also informative to understand how buying at all-time highs compares to buying at other times. An identical analysis is conducted on 9,073 data points where $c_i \le 0.95 \cdot c_{max}$. 0.95 is chosen arbitrarily and one could search over the entire space if so inclined. The results, shown in charts below, are structually similar to what is observed in the all-time high data. However, they differ in two ways. First, in years 1 and 5, the probability of a loss decreases from 0.264 to 0.214 and 0.103 to 0.06 respectively. This makes sense intuitively, by avoiding all-time highs, an investor is also avoiding the chance of being forced to buy and sell at extreme highs and lows.
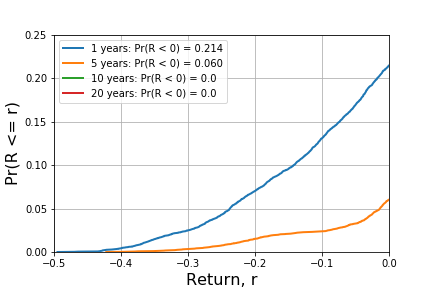
However, the probability of experiencing a loss of at least 10% is higher over both durations. The 1 year duration has a probability of loss greater than 10% equal to 0.131 while the 5 year is 0.024. The table below provides this information for a direct comparison.
| Duration | All-Time High, at least 10% loss | Less than 95% of High, at least 10% loss | All-Time High, at least 20% loss | Less than 95% of High, at least 20% loss |
|---|---|---|---|---|
| 1 | 0.114 | 0.131 | 0.031 | 0.070 |
| 5 | 0.031 | 0.024 | 0.013 | 0.015 |
Conclusion
These results show that buying and holding over extended periods of time, at least roughly 10 years, would have avoided incurring investment losses under any starting conditions - all-time highs or otherwise and support the idea that market timing was not a material factor for long-term investors during this time period.
For shorter time horizons, buying at times when the index was off its all-time highs led to a roughly 20% reduction in loss risk.